Mavis DB Usage Report
The usage report presents data on the number of API calls made and the amount of data stored across all the Mavis Databases in your account.
Note: The report displays data up till the previous day (as reflected in the latest sync date on the top left).
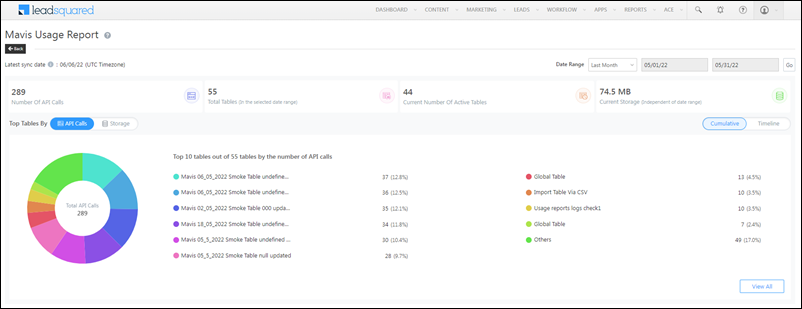
API Calls
When you filter by API Calls, you can view all the API calls made using Mavis APIs.
Filter the report by a set date range (This Week, This Month, Last Month, Custom, etc.) or use the custom date range filter to manually choose the ‘From’ and ‘To’ dates. The maximum date range you can filter by is 31 days.
Results are displayed in two views –
Cumulative
Represents the results as a donut chart with only the top 10 tables (with the highest API calls) being visible.
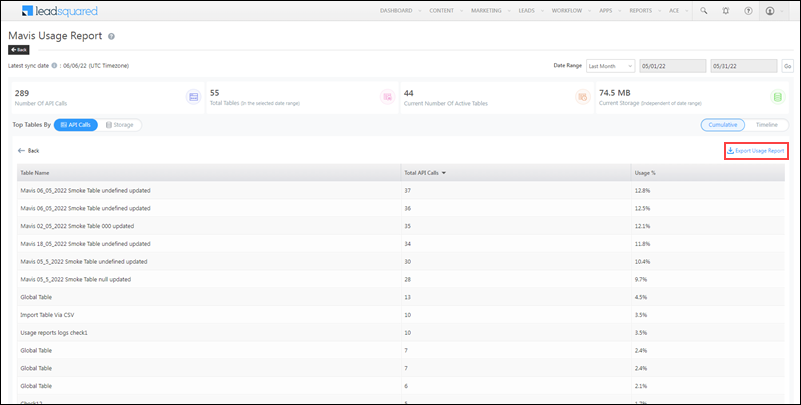
Click ![]() to see the total API calls and usage percentage of all the tables present in your tenant. To export the data to CSV, click
to see the total API calls and usage percentage of all the tables present in your tenant. To export the data to CSV, click ![]() . You’ll receive an email with a link to download the file.
. You’ll receive an email with a link to download the file.
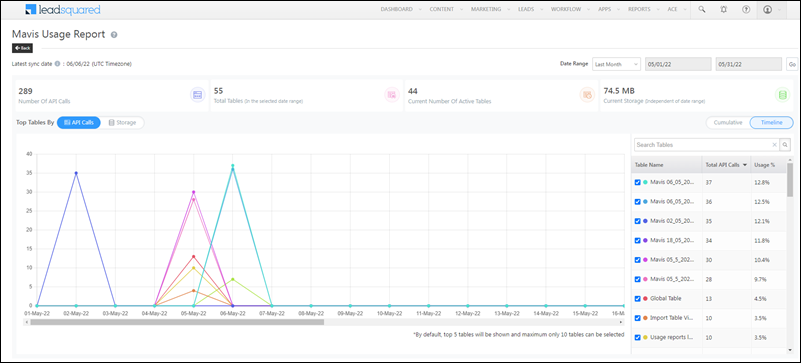
Timeline
Represents the API calls made on different dates across the selected time range. Click the checkbox alongside a table to view it on the timeline. Each table you select will be assigned a colour on the graph.
Note: The top 5 tables (in terms of total API calls) are shown by default, and you can select a maximum of 10 tables to view on the timeline.
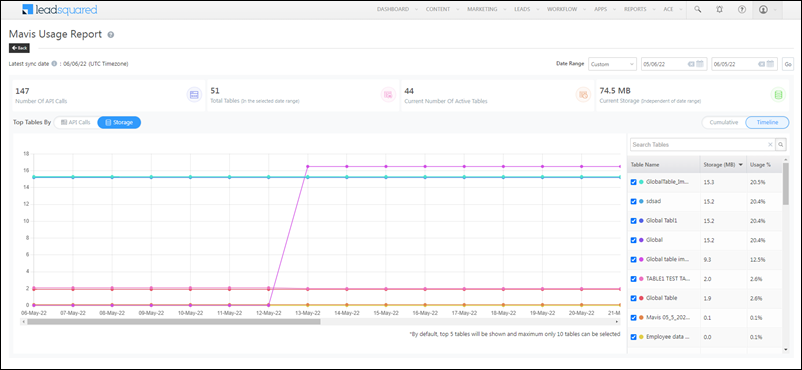
Storage
When you filter by Storage, you can view the amount of data stored (in MB) in the tables in your tenant.
Results are displayed in two views –
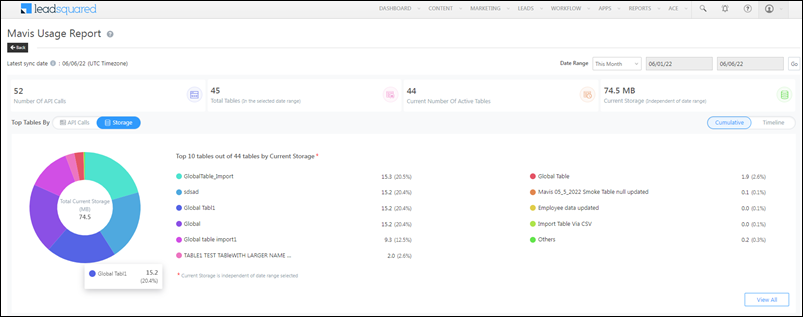
Cumulative
Represents the results as a donut chart with only the top 10 tables (by size) visible. Here, the cumulative storage as per the latest sync date is displayed. This is independent of the selected date range.
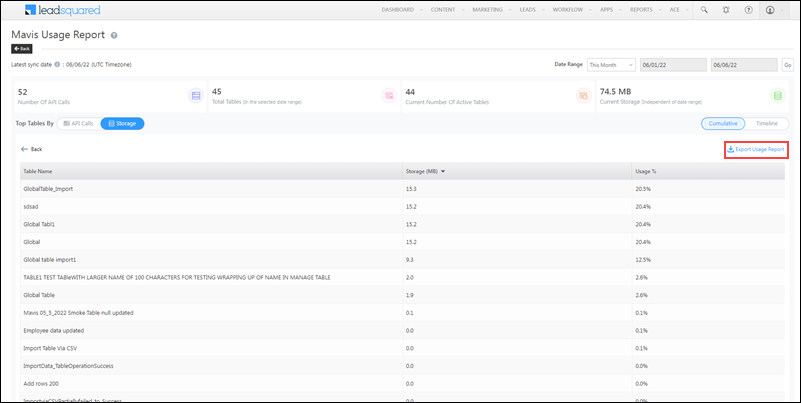
Click ![]() to see the table size and usage percentage of all the tables present in your tenant. To export the data to CSV, click
to see the table size and usage percentage of all the tables present in your tenant. To export the data to CSV, click ![]() . You’ll receive an email with a link to download the file.
. You’ll receive an email with a link to download the file.
Timeline
Represents the data stored on different dates across the selected time range. Click the checkbox alongside a table to view it on the timeline. Each table you select will be assigned a colour on the graph.
Filter the report by a set date range (This Week, This Month, Last Month, Custom, etc.) or use the custom date range filter to manually choose the ‘From’ and ‘To’ dates. The maximum date range you can filter by is 31 days.
Note: The top 5 tables (in terms of storage size) are shown by default, and you can select a maximum of 10 tables to view on the timeline.