
Error Handling
Response Codes
If an API call is successful, it returns a “200 OK” response. If there is an exception, an error code along with an exception message is returned. Here is the list of response codes and their meaning –
| Response Code | Description |
| 200 OK | This is the status code for successful API call. Check the message body to find JSON data if the API call is expected to return a result. |
| 401 Unauthorized | The API call was made with invalid access credentials. Check your accessKey and secretKey. |
| 400 Bad Request | The message body on the request is not as per API specification. Make sure that content type is set to “application/json” and the JSON body has correct attribute names and structure. |
| 404 Not Found | The API could not be found. Please check the API signature (syntax). |
| 500 Internal Server Error | The API called failed. There could be many reasons for it. Check the exception message to get more details. |
In the case of a 500 Internal Server Error, a JSON response body which will provide information about the error also appears.
Below is an example of an error when a mandatory parameter of an API call is not being passed.
{
  "Status":"Error",
  "ExceptionType":"MXMandatoryAttributeMissingException",
  "ExceptionMessage":"'leadId' is mandatory for updating lead"
}
Logging API calls
We strongly recommend that you log all API calls and their results while working on the integration with LeadSquared. Maintain a log file as part of your application and log the API signature (you may strip the API keys) along with any API URL parameters and request body (JSON). Log the API response code. In case of an error, log the JSON body of the error message. Once your integration is stable you can reduce the level of logging and log only API name (signature), response code and error message if any.
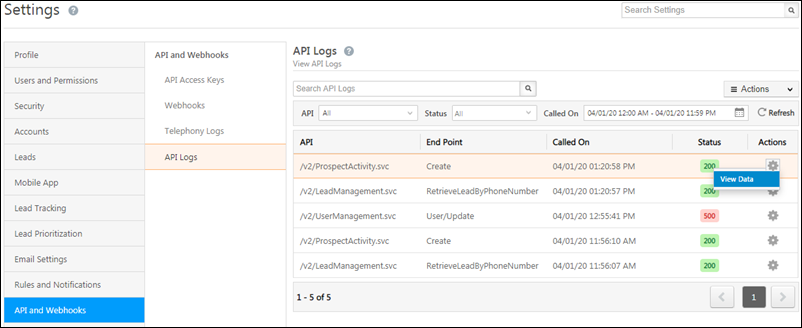
You can also view the logs of all your API calls in the LeadSquared web application. This includes successful responses, as well as errors (provided the access key and secret key are correct). To access the logs,
- Log-in to the LeadSquared application and navigate to My Profile>Settings>API and Webhooks>API logs.
- Use the search bar, or filter by API type, status, and date range.
- To view data that was retrieved or posted, under the Actions columns, hover your cursor over the settings
 icon, then click View Data.
Note:
- We only display 1000 logs at a time. Use appropriate filters to get a smaller set of results.
- We only keep logs of the previous 30 days.
- While searching, you can set a time range of a maximum of 7 days.
You can also export the logs to a CSV file – hover your cursor over the Actions menu, and click Export Logs. You can only export up to 1000 results.
DateTime Format
Please note that the DateTime format for all date fields is “yyyy-MM-dd HH:mm:ss”.
- The date should always be in UTC. You’ll have to convert the DateTime from your time-zone to UTC.
- The time is in 24-hour format and there is a space between date and time.
For example,“2018-10-05 14:34:53” is a valid value that represents 5th Oct 2018, 2:34:53 PM in UTC.
Note: Date-time fields returned in the API response will contain milliseconds and have the format “yyyy-MM-dd HH:mm:ss.SSS”. However, the date-time format accepted for all input/update calls is “yyyy-MM-dd HH:mm:ss” (must not contain milliseconds).
What’s Next?
Find out the API rate limits associated with your LeadSquared subscription plan.


