Lapps Usage Dashboard
1. Feature Overview
The Lapp Usage Dashboard provides detailed visibility into how Lapps are being used within your account. It offers insights into request volumes, performance trends, and error patterns across all Lapp integrations.
Note:
- Lapp logs will be retained for the past 7 days, and usage summary data will be stored for the last 3 months.
- Data tracking began on December 6, 2024, only information from this date onward will be available.
2. Accessing the Dashboard
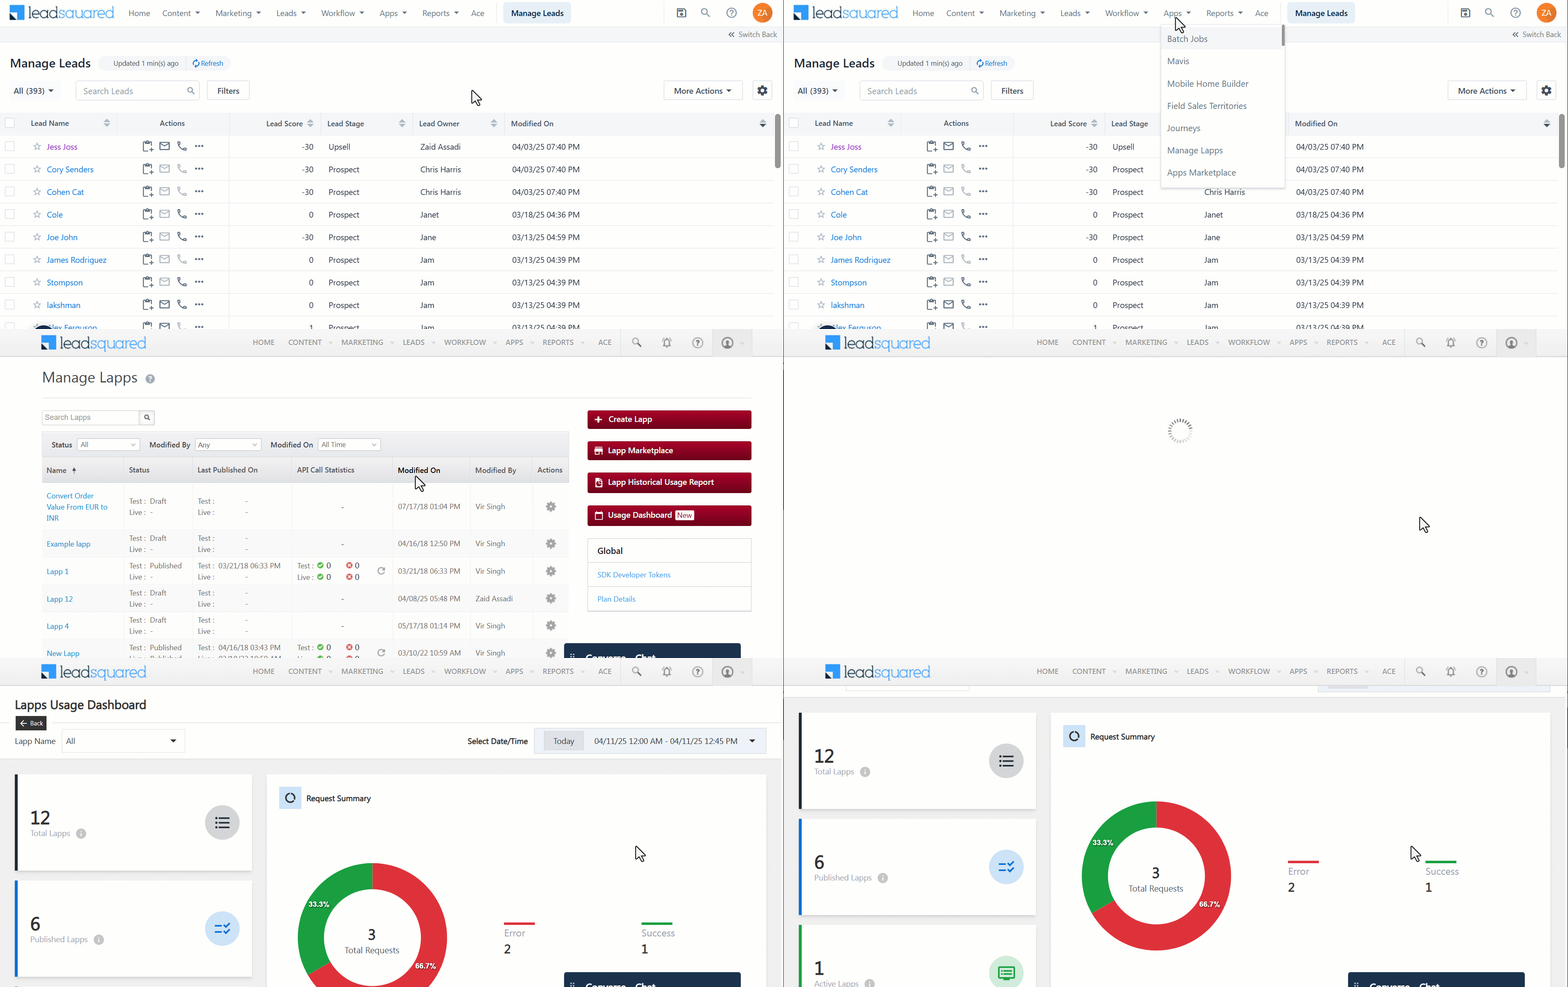
Navigate to Apps>Manage Lapps>Usage Dashboard.
3. Filter the Dashboard
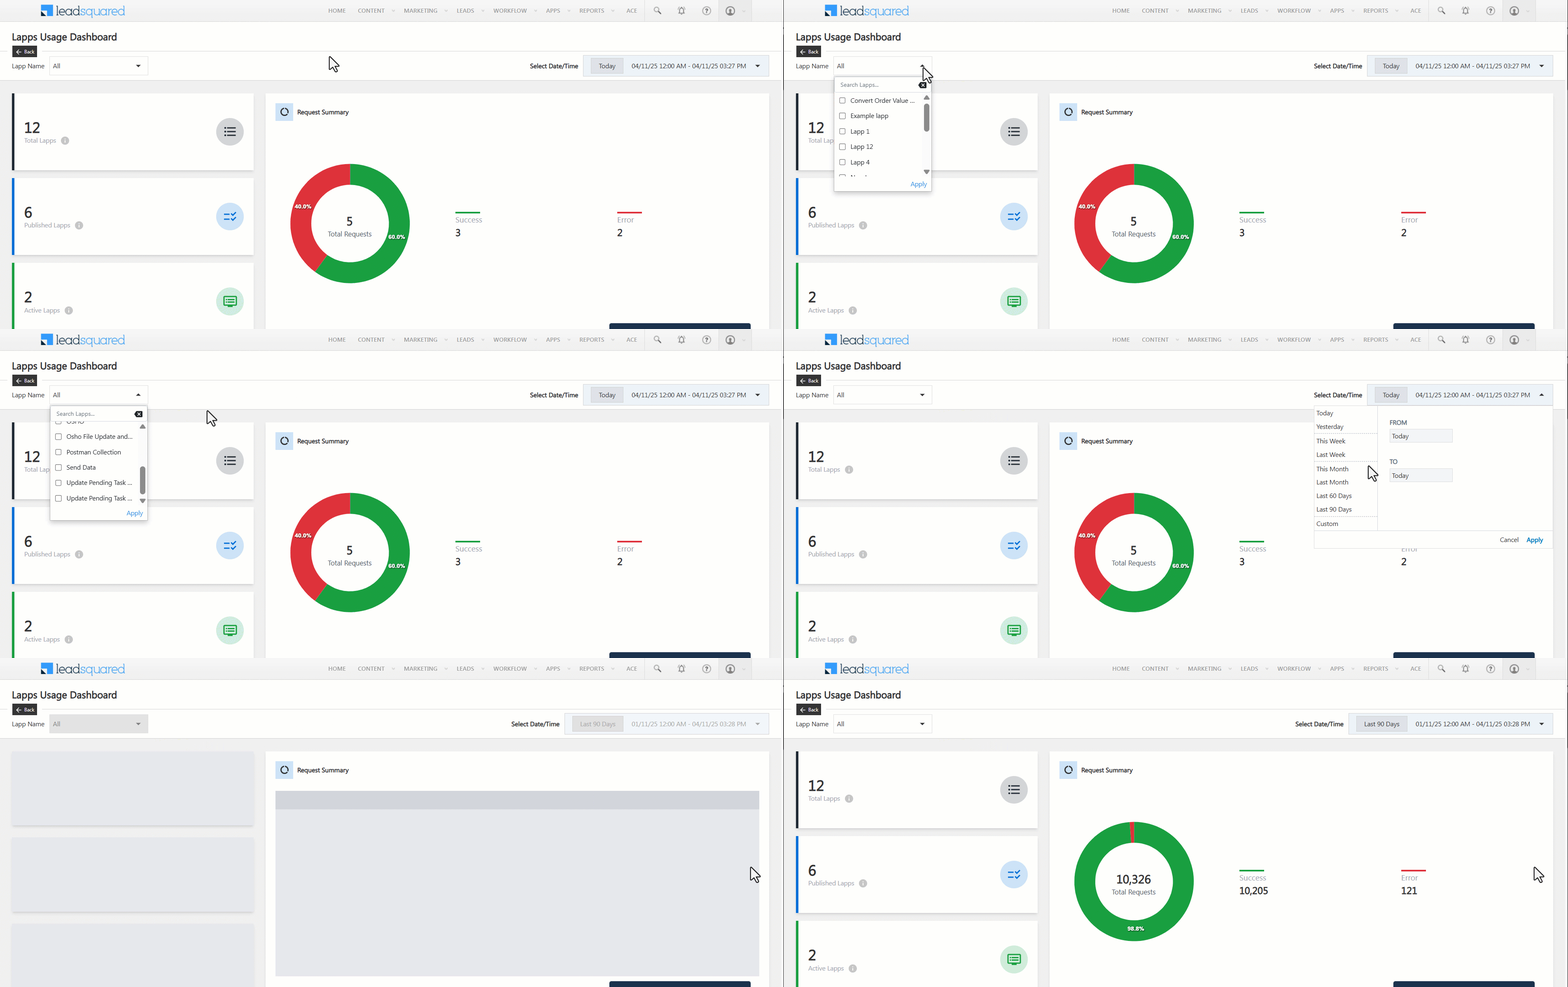
You can filter the dashboard by selecting a specific Lapp or all Lapps, and by specifying a date and time range.
4. Dashboard Features
The dashboard is equipped with multiple tools and visual components to help users interpret Lapp usage data more efficiently. Below is a breakdown of the key capabilities available within the dashboard:
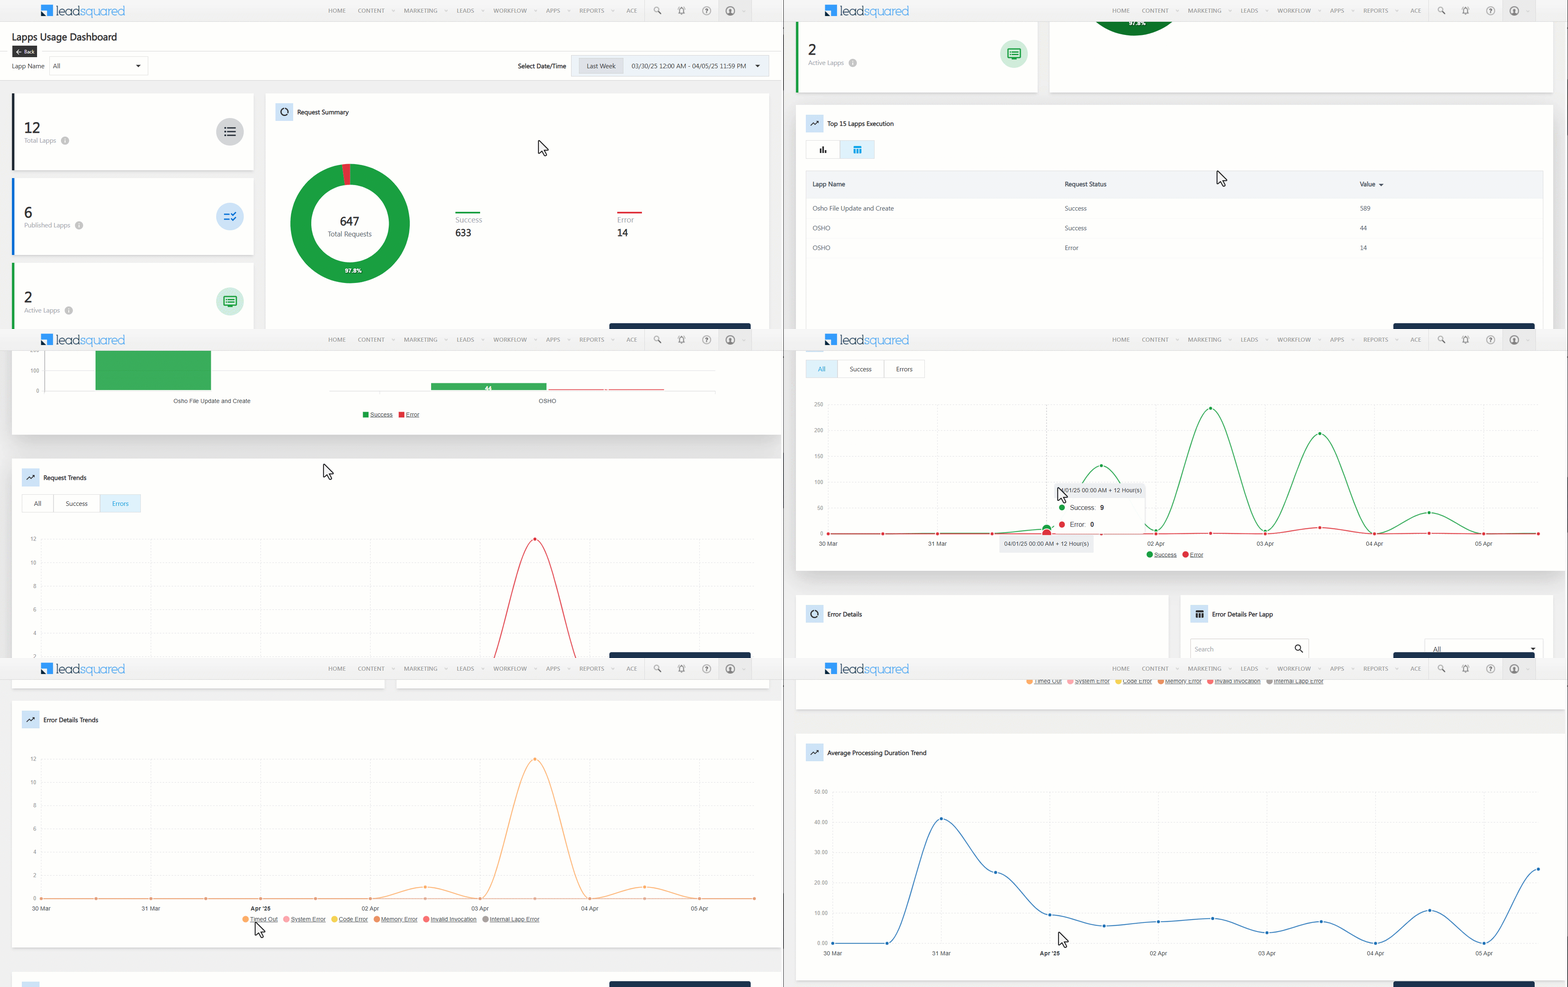
1. Metrics Overview
-
Total request counts, successful executions, and failures.
-
Trend analysis over time.
2. Performance Insights
-
Identify top-used Lapps.
-
Monitor average execution durations.
3. Error Analysis
-
Categorized error breakdowns.
-
Time-based error trends.


